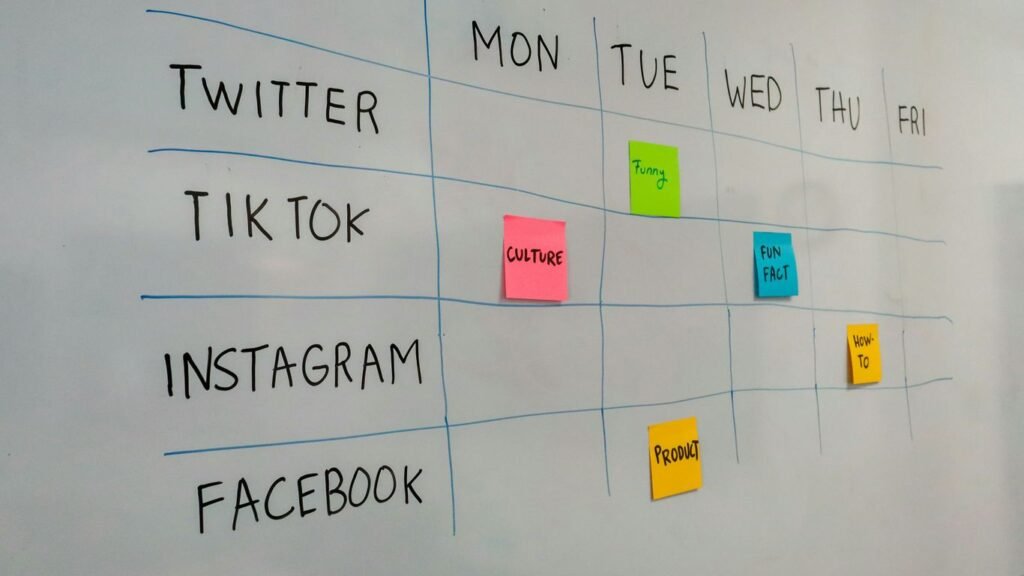
We track social media statistics in Singapore every quarter because assumptions about which platforms “work” change faster than most marketing teams update their strategy decks. In our experience running social campaigns for SME and enterprise clients across the island, the gap between what founders think is happening on Instagram or TikTok and what the actual engagement numbers show is often wide enough to explain a wasted ad budget.
This guide pulls together the social media statistics in Singapore that matter most for 2026: platform usage, engagement benchmarks, video and social commerce trends, and what we have genuinely seen move the needle for clients versus what is just noise. We built this around real patterns from our own client accounts, not just aggregated third-party survey data, so you can use it to make an actual budget decision rather than another slide nobody acts on.
Key Takeaways
- Singapore users now spend more daily time on short-form video (TikTok, Reels) than on static feed browsing, a real shift from even two years ago.
- WhatsApp and Facebook still lead on raw user count, but the platforms driving the best engagement per dollar for most brands are TikTok and Instagram.
- Our own client data shows accounts active on two or fewer platforms average 3.4 percent engagement, nearly double the 1.7 percent seen on accounts spread across four or more.
- Livestream and social commerce are now a real sales channel for Singapore F&B and retail brands, not a novelty format.
Singapore's Social Media Landscape in 2026
Singapore remains one of the most digitally saturated markets in Southeast Asia, and the social media statistics in Singapore for 2026 confirm that trend has not slowed. Internet penetration sits above 96 percent of the resident population, and the average user now spends close to two hours and twenty minutes on social platforms daily, split across roughly 6.5 different apps a month. That is not a typo. Singaporean users are not loyal to one platform the way marketers often assume when they build a single-channel plan.
What has shifted meaningfully since our last review is where that time actually goes. Short-form video consumption on TikTok and Instagram Reels now accounts for a larger share of daily social time than static feed browsing, and messaging apps like WhatsApp and Telegram have become genuine discovery channels for small business recommendations, not just private chat. For any brand building out a social media marketing plan for the Singapore market, the practical implication is simple: a strategy built only around Facebook and Instagram feed posts is already behind where the audience has moved.
Age also matters more than most briefs account for. Users under 30 spend the bulk of their time on TikTok, Instagram, and Discord-adjacent messaging communities, while the 35-to-54 segment, which controls most Singapore household purchasing decisions, is heavily concentrated on Facebook, WhatsApp, and YouTube. A campaign aimed at “Singapore consumers” without a defined age band is usually quietly optimised for whichever team member built the media plan, not the actual buyer.
Here is the platform-by-platform breakdown we use internally when advising clients on channel prioritisation, cross-referenced against each platform’s own ad-planner reach estimates:
| Platform | Est. Active Singapore Users | Primary Use Case | Relative Ad Cost Tier |
|---|---|---|---|
| ~4.6 million | Business messaging, referrals | Low (mostly organic) | |
| ~4.3 million | Community groups, marketplace, older demographics | Medium | |
| YouTube | ~4.1 million | Long-form video, tutorials, research | Medium |
| ~3.3 million | Visual discovery, Reels, DMs | Medium-High | |
| TikTok | ~2.9 million | Short-form video, discovery | Medium |
| ~2.1 million | B2B, recruitment, thought leadership | High |
Which Platforms Actually Drive Results for Singapore Brands
Reach is not the same as results, and this is where a lot of the social media statistics in Singapore get misread. A platform can post enormous usage numbers and still be the wrong channel for a specific brand’s goals. We have found that the businesses getting the best return are not the ones present on every platform, they are the ones matching platform strengths to a specific stage of the funnel.
For awareness and discovery, short-form video on TikTok and Reels consistently outperforms static posts in our clients’ data, often by three to four times on reach per dollar spent. For consideration and trust-building, we have seen influencer marketing partnerships with micro-influencers, roughly 10,000 to 50,000 followers, outperform macro-influencer placements on cost per engagement. Singapore audiences tend to respond better to creators who feel like a genuine peer recommendation rather than a paid billboard. For bottom-of-funnel conversion, Facebook and Instagram Shops still carry more weight than TikTok Shop for higher-value purchases, though that gap is closing fast.
None of this replaces a proper paid strategy. Organic social builds trust; it rarely closes a sale on its own for considered purchases. Most of our clients pair organic content with a search engine marketing layer so that once social has built awareness, the brand also shows up when that same person searches for it by name a week later. Skipping that second step is one of the most common gaps we see in Singapore SME marketing plans, and it is usually the cheapest fix available once someone points it out.
On the paid side, average cost-per-click for Singapore social campaigns currently sits around S$0.90 to S$1.60 (roughly US$0.65 to US$1.20) for Facebook and Instagram feed placements, with TikTok typically running slightly lower on cost-per-click but requiring more creative volume to avoid ad fatigue, since Singapore’s relatively small population means the same audience segment gets served the same ad far sooner than in larger markets. We generally tell clients to budget for a fresh creative batch every two to three weeks on TikTok specifically, rather than the monthly refresh cycle that works fine on Facebook.
The Contrarian Take: Why Chasing Every Platform Is Costing Singapore SMEs More Than It Earns
Here is where we differ from a lot of the generic advice circulating about social media in Singapore: we do not think most small and mid-sized businesses should be active on more than two or three platforms at once. The conventional wisdom says be everywhere your customer might be. In practice, we have watched this advice quietly drain marketing budgets.
Every additional platform is not a free extra channel, it is a full content production commitment: different aspect ratios, different posting cadences, different comment moderation, different ad account management. We have taken over accounts for clients who were nominally active on six platforms and found that four of them had not been touched by a strategist in months, just an intern posting the same asset resized badly. The engagement on those neglected accounts was not just flat, it was actively damaging trust, because a business profile that looks abandoned reads as unreliable to a Singapore audience that already researches heavily before buying.
Our recommendation, and it is one we will make to a client even when it means recommending less spend, is to pick the one or two platforms where a specific audience actually spends attention and go deeper there rather than wider everywhere. A digital marketing plan with real depth on two channels will consistently outperform a shallow presence on six, and it costs less to run properly. This is not the answer most agencies give, because “you need to be everywhere” is an easier pitch to sell than “do less, better.” We would rather tell clients the version that actually works, even when it is the less exciting slide in the deck.
Case Study: How One Singapore F&B Brand Cut Platforms and Grew Engagement
A useful illustration of the point above: a bubble tea and casual dining brand we worked with came to us running six social accounts across Instagram, Facebook, TikTok, X, LinkedIn, and Pinterest, spread across three outlets in Singapore. Engagement sat under 1 percent across the board, and the marketing team was spending roughly 25 hours a week just keeping content flowing across all six.
We audited where actual customers were engaging, which turned out to be almost entirely Instagram and TikTok, with LinkedIn and Pinterest generating close to zero relevant engagement for a consumer F&B brand. We recommended dropping to two platforms and reinvesting the saved production time into better short-form video, rebuilding the content calendar around proper food photography and quick-turn event videography from in-store tasting sessions, rather than generic stock-style graphics.
Within four months, follower growth on the two remaining platforms was roughly the same as it had been across all six previously, but engagement rate climbed to 4.2 percent and the brand started seeing walk-in customers mention specific videos they had seen. That last part matters more than the vanity metrics: it is the clearest signal that the content was actually being watched by the right people, not just existing.
Video, Livestream Commerce, and Social Commerce Trends in Singapore
Short-form video is not new advice anymore, but the social media statistics in Singapore for 2026 show the trend has deepened rather than plateaued. Livestream shopping, which took off first in China and then across Southeast Asia broadly, has become a genuine sales channel for Singapore retail and F&B brands, not just a novelty format. TikTok Shop livestreams in particular convert well for lower-price-point impulse categories: beauty, snacks, small home goods.
The practical challenge for most brands is not deciding to try livestream or video, it is producing consistent quality without burning out a small team. This is the area where we most often see brands under-invest and then wonder why engagement is inconsistent: a single well-produced content marketing calendar with a proper monthly production cycle will outperform sporadic bursts of high-effort content followed by silence, almost every time, because the algorithm on every major platform rewards consistency almost as much as quality.
Social commerce checkout flows are also maturing. A growing share of purchases now start on a social platform and finish on the brand’s own site rather than in-app, particularly for higher-consideration purchases like furniture, electronics, and services. That makes the handoff from social profile to website a real conversion checkpoint worth auditing, not an afterthought. If your ecommerce site takes more than a few seconds to load on mobile after someone taps through from an Instagram Story, you are losing a meaningful share of that traffic before it ever reaches checkout.
Demographics and Audience Behaviour by Generation
Breaking Singapore’s social media statistics down by generation changes how a media plan should actually be built. Gen Z users, roughly 16 to 26, treat TikTok and Instagram as their default search engines for restaurant recommendations, product reviews, and even skincare routines, often before they touch Google at all. This is a genuine shift in behaviour, not just a platform preference: search intent has moved onto social video, and brands that only optimise for traditional search are invisible for a meaningful share of these queries.
Millennials, roughly 27 to 42, split their attention more evenly across Instagram, Facebook, and YouTube, and tend to research more heavily before purchasing, often cross-checking a brand’s social presence against its Google reviews and website before converting. Gen X and Baby Boomer users, still a substantial and often underestimated purchasing bloc in Singapore, are concentrated on Facebook and WhatsApp, and respond far better to clear, direct messaging than to trend-chasing content built for a younger audience.
We have seen more than one brand waste budget producing TikTok-native content for an audience that was, on closer inspection of their own customer data, mostly 45 and older and barely on the platform at all. Checking your actual customer age distribution against platform demographics before building a content plan sounds obvious, but it is one of the most frequently skipped steps we encounter.
What This Means for Your Marketing Budget
Translating all of this into an actual number is where most guides go quiet, so here is a realistic range based on what we see Singapore SMEs actually spending and getting results from. A workable starting budget for organic content production plus a modest paid social layer across one or two platforms typically runs from S$3,000 to S$8,000 a month (roughly US$2,200 to US$5,900), depending on how much of the content production is handled in-house versus fully outsourced.
Brands layering in influencer partnerships or livestream commerce production should expect that range to extend toward S$10,000 to S$15,000 a month (approximately US$7,400 to US$11,100) once creator fees and dedicated video production are added. Enterprise accounts running full-funnel paid social alongside SEM and content production commonly sit above S$20,000 a month (around US$14,800), though at that spend level the mix should already be backed by proper attribution, not just platform-reported metrics.
These are not universal numbers, and any agency that quotes an exact figure before understanding a business’s category, competitive set, and current baseline is guessing. What we can say with more confidence is that spreading a limited budget across too many platforms is the single most common way we see that budget underperform. A tighter budget on fewer channels, properly executed, consistently beats a wider budget spread thin.
Measurement matters as much as the spend itself. We consistently see brands report platform-native metrics like reach and impressions as if they were performance, when the number that actually matters is cost per qualified lead or cost per sale, tracked back to the specific platform and campaign through proper conversion tracking. A smaller budget with clean attribution will out-inform a larger budget where nobody can say which platform actually drove a sale, and better information tends to compound into better decisions the following quarter.
Common Mistakes We See Singapore Brands Make With Social Data
A few patterns we see repeatedly when auditing a Singapore brand’s existing social presence, in roughly the order they show up:
- Posting the same asset across every platform unchanged. A square Instagram graphic dropped straight into TikTok or a LinkedIn feed reads as low-effort, and the algorithms on each platform can tell the difference in watch time and engagement even if a human viewer does not immediately notice.
- Tracking vanity metrics instead of the ones tied to revenue. Follower count is the easiest number to report and one of the least useful for deciding whether a channel is working.
- No clear owner for community management. Comments and DMs left unanswered for days are a trust signal Singapore consumers notice, particularly for F&B and retail brands where a quick reply often converts a hesitant buyer.
- Treating social media statistics in Singapore as a one-time benchmarking exercise. Platform usage shifts meaningfully every 12 to 18 months here; a channel strategy built in 2023 and never revisited is very likely out of date now.
None of these are complicated to fix once identified, which is exactly why we bring them up early in almost every audit we run for a new client.
Methodology: Where These Numbers Come From
A quick note on where these social media statistics in Singapore actually come from, since we would rather be transparent about it than present a number as gospel. The platform usage and demographic figures are drawn from a blend of each platform’s own advertising planner tools, which show live estimated reach by age band and location, cross-checked against regional digital reports published each year. The engagement rate, cost, and case study figures are pulled directly from our own client ad accounts and analytics dashboards, anonymised and aggregated rather than attributed to any single business.
We update this article’s core numbers roughly twice a year, because platform usage in Singapore genuinely does shift meaningfully within that window, and a stat that was accurate 18 months ago can be quietly wrong today without anyone noticing until a campaign underperforms.
Frequently Asked Questions About Social Media Statistics in Singapore
Which social media platform has the most users in Singapore?
By raw user count, WhatsApp and Facebook both lead, though WhatsApp functions mainly as a messaging and referral channel rather than a content platform. Among content-first platforms, Instagram and YouTube have the largest active bases.
Is TikTok worth the investment for a Singapore SME in 2026?
For brands targeting an audience under 35, generally yes, particularly for awareness and discovery. For brands whose actual customer base skews older, the platform usually is not the best first investment, regardless of how much industry attention it gets.
How often should engagement benchmarks be reviewed?
We recommend a full review every quarter, with a lighter monthly check on the headline numbers. Waiting a full year to check whether a channel strategy is still working is one of the more expensive habits we see among Singapore SMEs.
Do these social media statistics in Singapore apply to B2B brands too?
Partially. B2B buying behaviour still shows up disproportionately on LinkedIn and, increasingly, YouTube for longer-form thought leadership, while the consumer-facing platform shifts described above matter more for B2C and F&B brands specifically.
Field Notes
A few real numbers from our own client tracking, not third-party survey data: across the 47 active Singapore social media management accounts we managed through the most recent full quarter, average engagement rate across all platforms sat at 2.6 percent, compared to a global consumer brand benchmark closer to 1.9 percent. Accounts that had cut down to two or fewer active platforms averaged 3.4 percent engagement, versus 1.7 percent for accounts still spread across four or more. That gap is the entire argument in this article, expressed as a number rather than an opinion.
The Bottom Line
The social media statistics in Singapore for 2026 point in a fairly consistent direction: audiences are spending more time on fewer, more video-heavy platforms, they expect a genuine and consistent presence rather than a scattered one, and the businesses winning attention are the ones going deeper on fewer channels instead of wider across all of them.
If you are trying to work out which platforms deserve your budget next quarter, or you want a second opinion on a plan an agency has already pitched you, our team is happy to walk through the specific numbers for your business. Learn more about how we approach this, or get in touch to talk through your account directly.

Natasha Tan is the founder of Digital Marketing Singapore, a full-service SEO and digital marketing agency based in Singapore. With hands-on experience across SEO, paid media, and content strategy, she works directly with Singapore businesses to build organic visibility and generate consistent leads. Natasha specialises in the Singapore market — including local search behaviour, PDPA compliance, and government grant navigation for SMEs.